Trading is not only about entries, stop loss, and targets. While most retail traders focus only on these three elements, professional traders understand that the real edge lies in understanding the market’s condition. Just like a doctor measures a person’s pulse before giving treatment, a trader must measure the market’s pulse before risking capital.
The Pulse Dashboard in Brahmastra AI Indicator V6.1 is built with this exact philosophy. It helps traders understand whether the market is slow, aggressive, directional, or deceptive. This feature is designed to guide traders on position sizing, trade selection, and expectations for the day, which most indicators completely ignore.
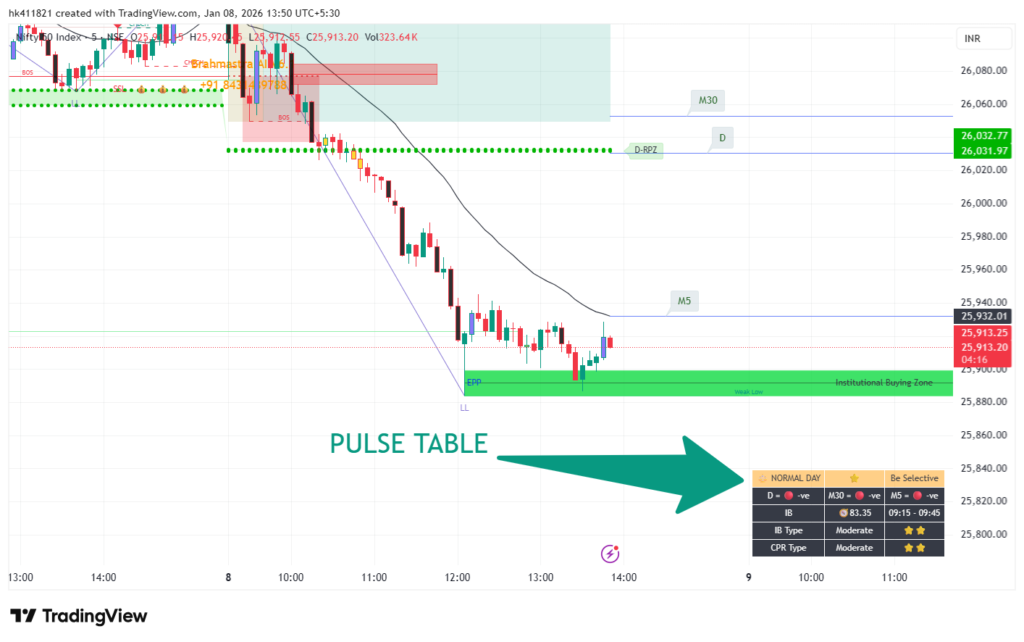
Img :- 1.1 pulse dashboard view
What Is the Pulse Dashboard?
The Pulse Dashboard is a smart analytical panel inside Brahmastra AI Indicator V6.1 that provides real-time insight into the market environment. Instead of trading based on assumptions, traders can clearly see how the market is behaving and adapt accordingly.
It answers critical questions such as whether the day is suitable for aggressive trading, whether capital protection should be the priority, or whether the market supports trend-following trades. This clarity helps traders avoid emotional decisions and random overtrading.
Day Type Classification – Trade According to Market Nature
The first row of the Pulse Dashboard identifies the Day Type. This is one of the most important aspects of professional trading because every trading day does not deserve the same position size or expectations.
There are five major day types identified by Brahmastra AI, each with its own trading behavior and rules.
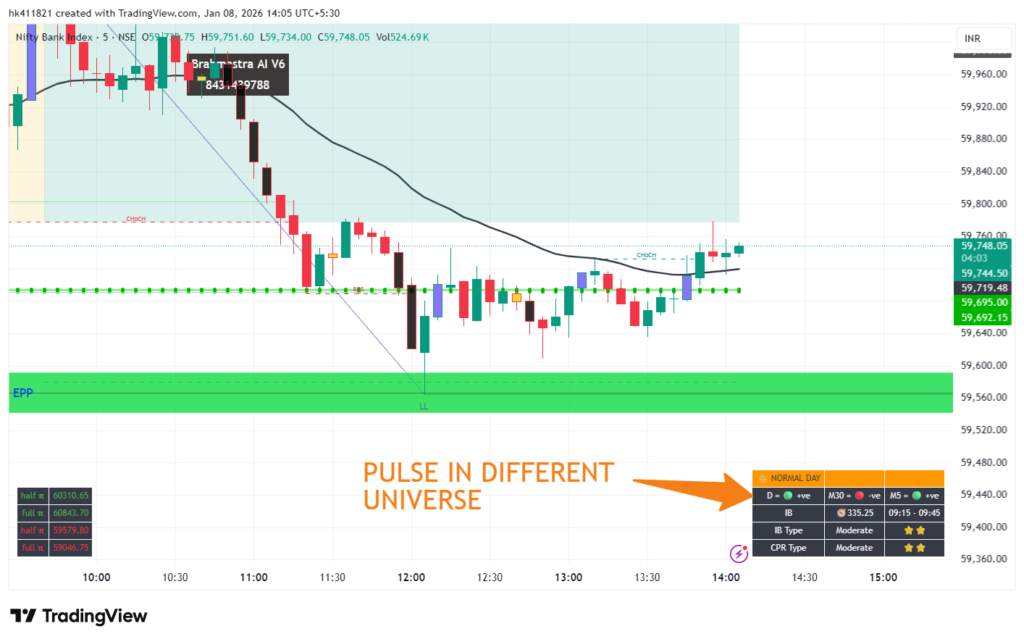
Normal Day
A Normal Day indicates a balanced market where no major directional movement is expected. The price usually rotates without momentum, making aggressive trading unnecessary.
Key characteristics:
- No strong directional bias
- Market remains rotational or sideways
- Recommended quantity: 1/3rd of normal size
- Focus on quick and conservative trades
Img :- 2.1 Normal day example
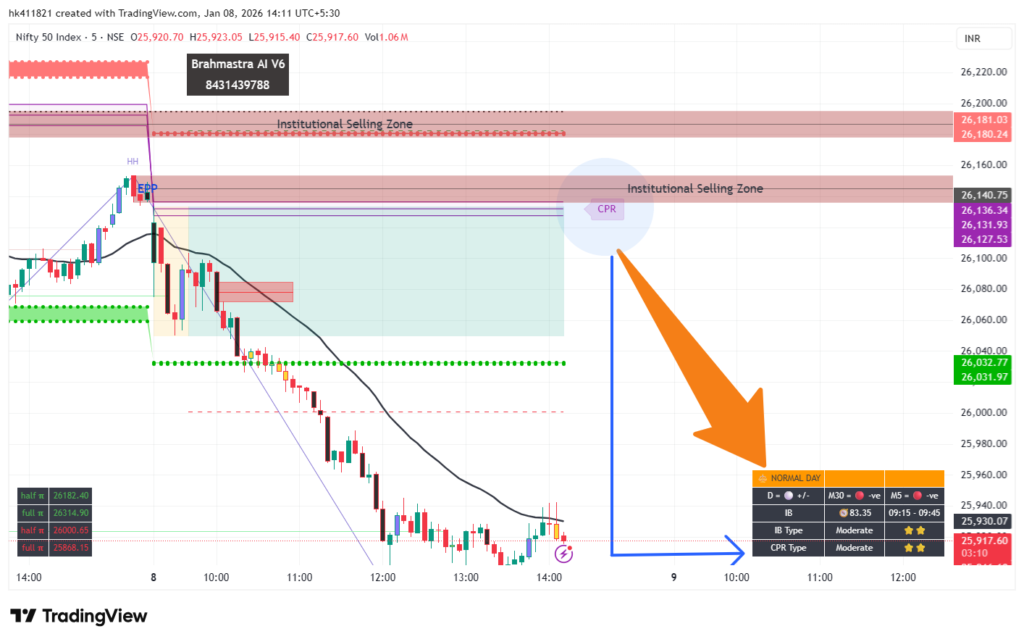
Quiet Day
Quiet Days are the most dangerous for retail traders. Accuracy drops significantly, and stop-loss hits become frequent. Capital protection is the top priority on such days.
Key characteristics:
- Very low trade accuracy
- High stop-loss probability
- Best decision is to avoid trading
- If trading, use the minimum possible quantity
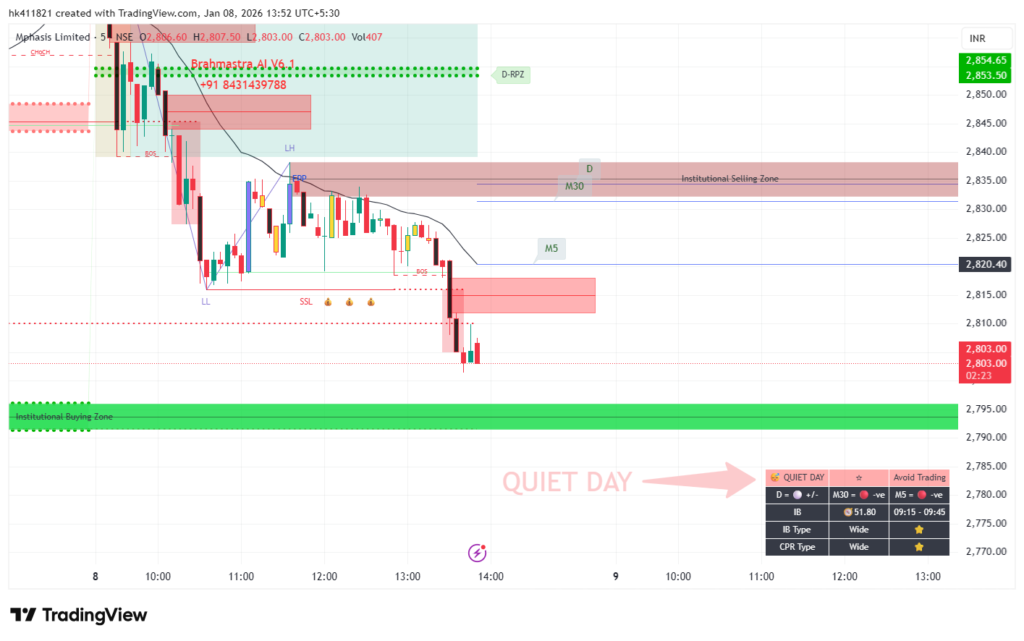
Img 2.2 Quiet day example
Booming Day
Booming Days indicate strong market participation and momentum. These days offer high-quality opportunities if traded with discipline.
Key characteristics:
- High probability of strong movement
- Recommended quantity: 2/3rd
- Ideal for momentum and breakout trades
- Strict adherence to Rudra rules is required
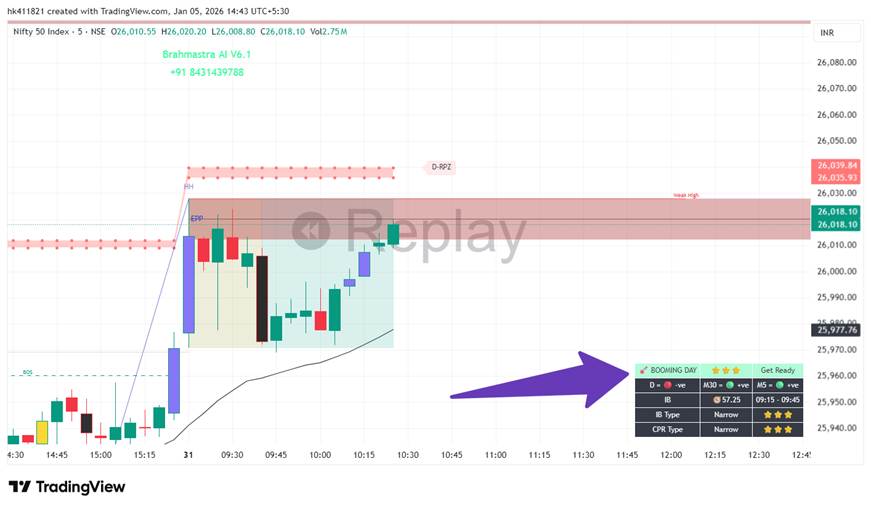
Img :- 2.3 Booming day example
Initiative Day
Initiative Days are similar to Booming Days but with slightly lower conviction. While opportunities exist, traders must wait for confirmation.
Key characteristics:
- 50% probability of large movement
- Recommended quantity: 2/3rd
- Requires patience and confirmation-based trading
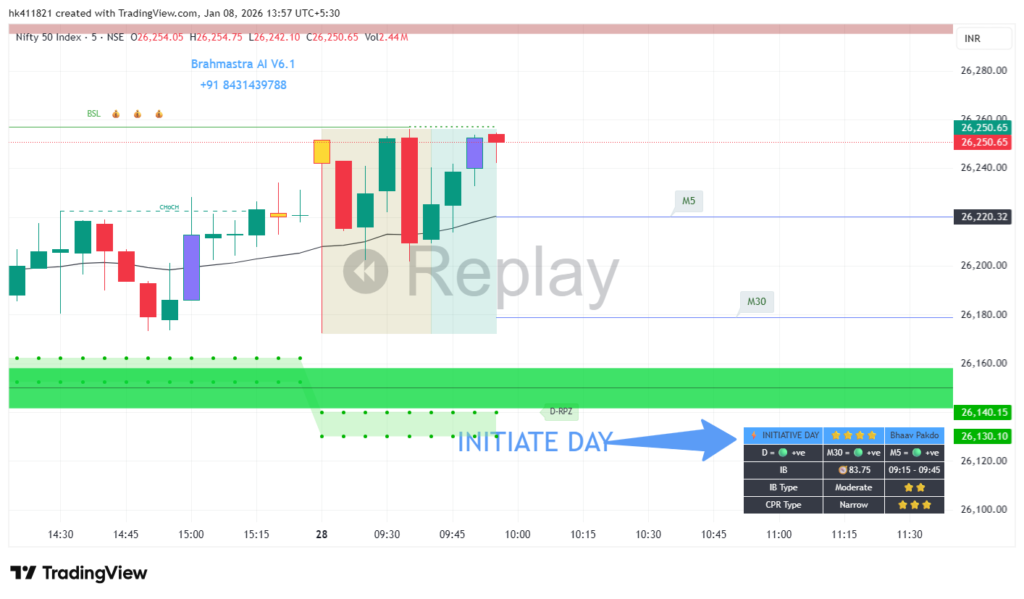
Img :- 2.4 Initiative day example
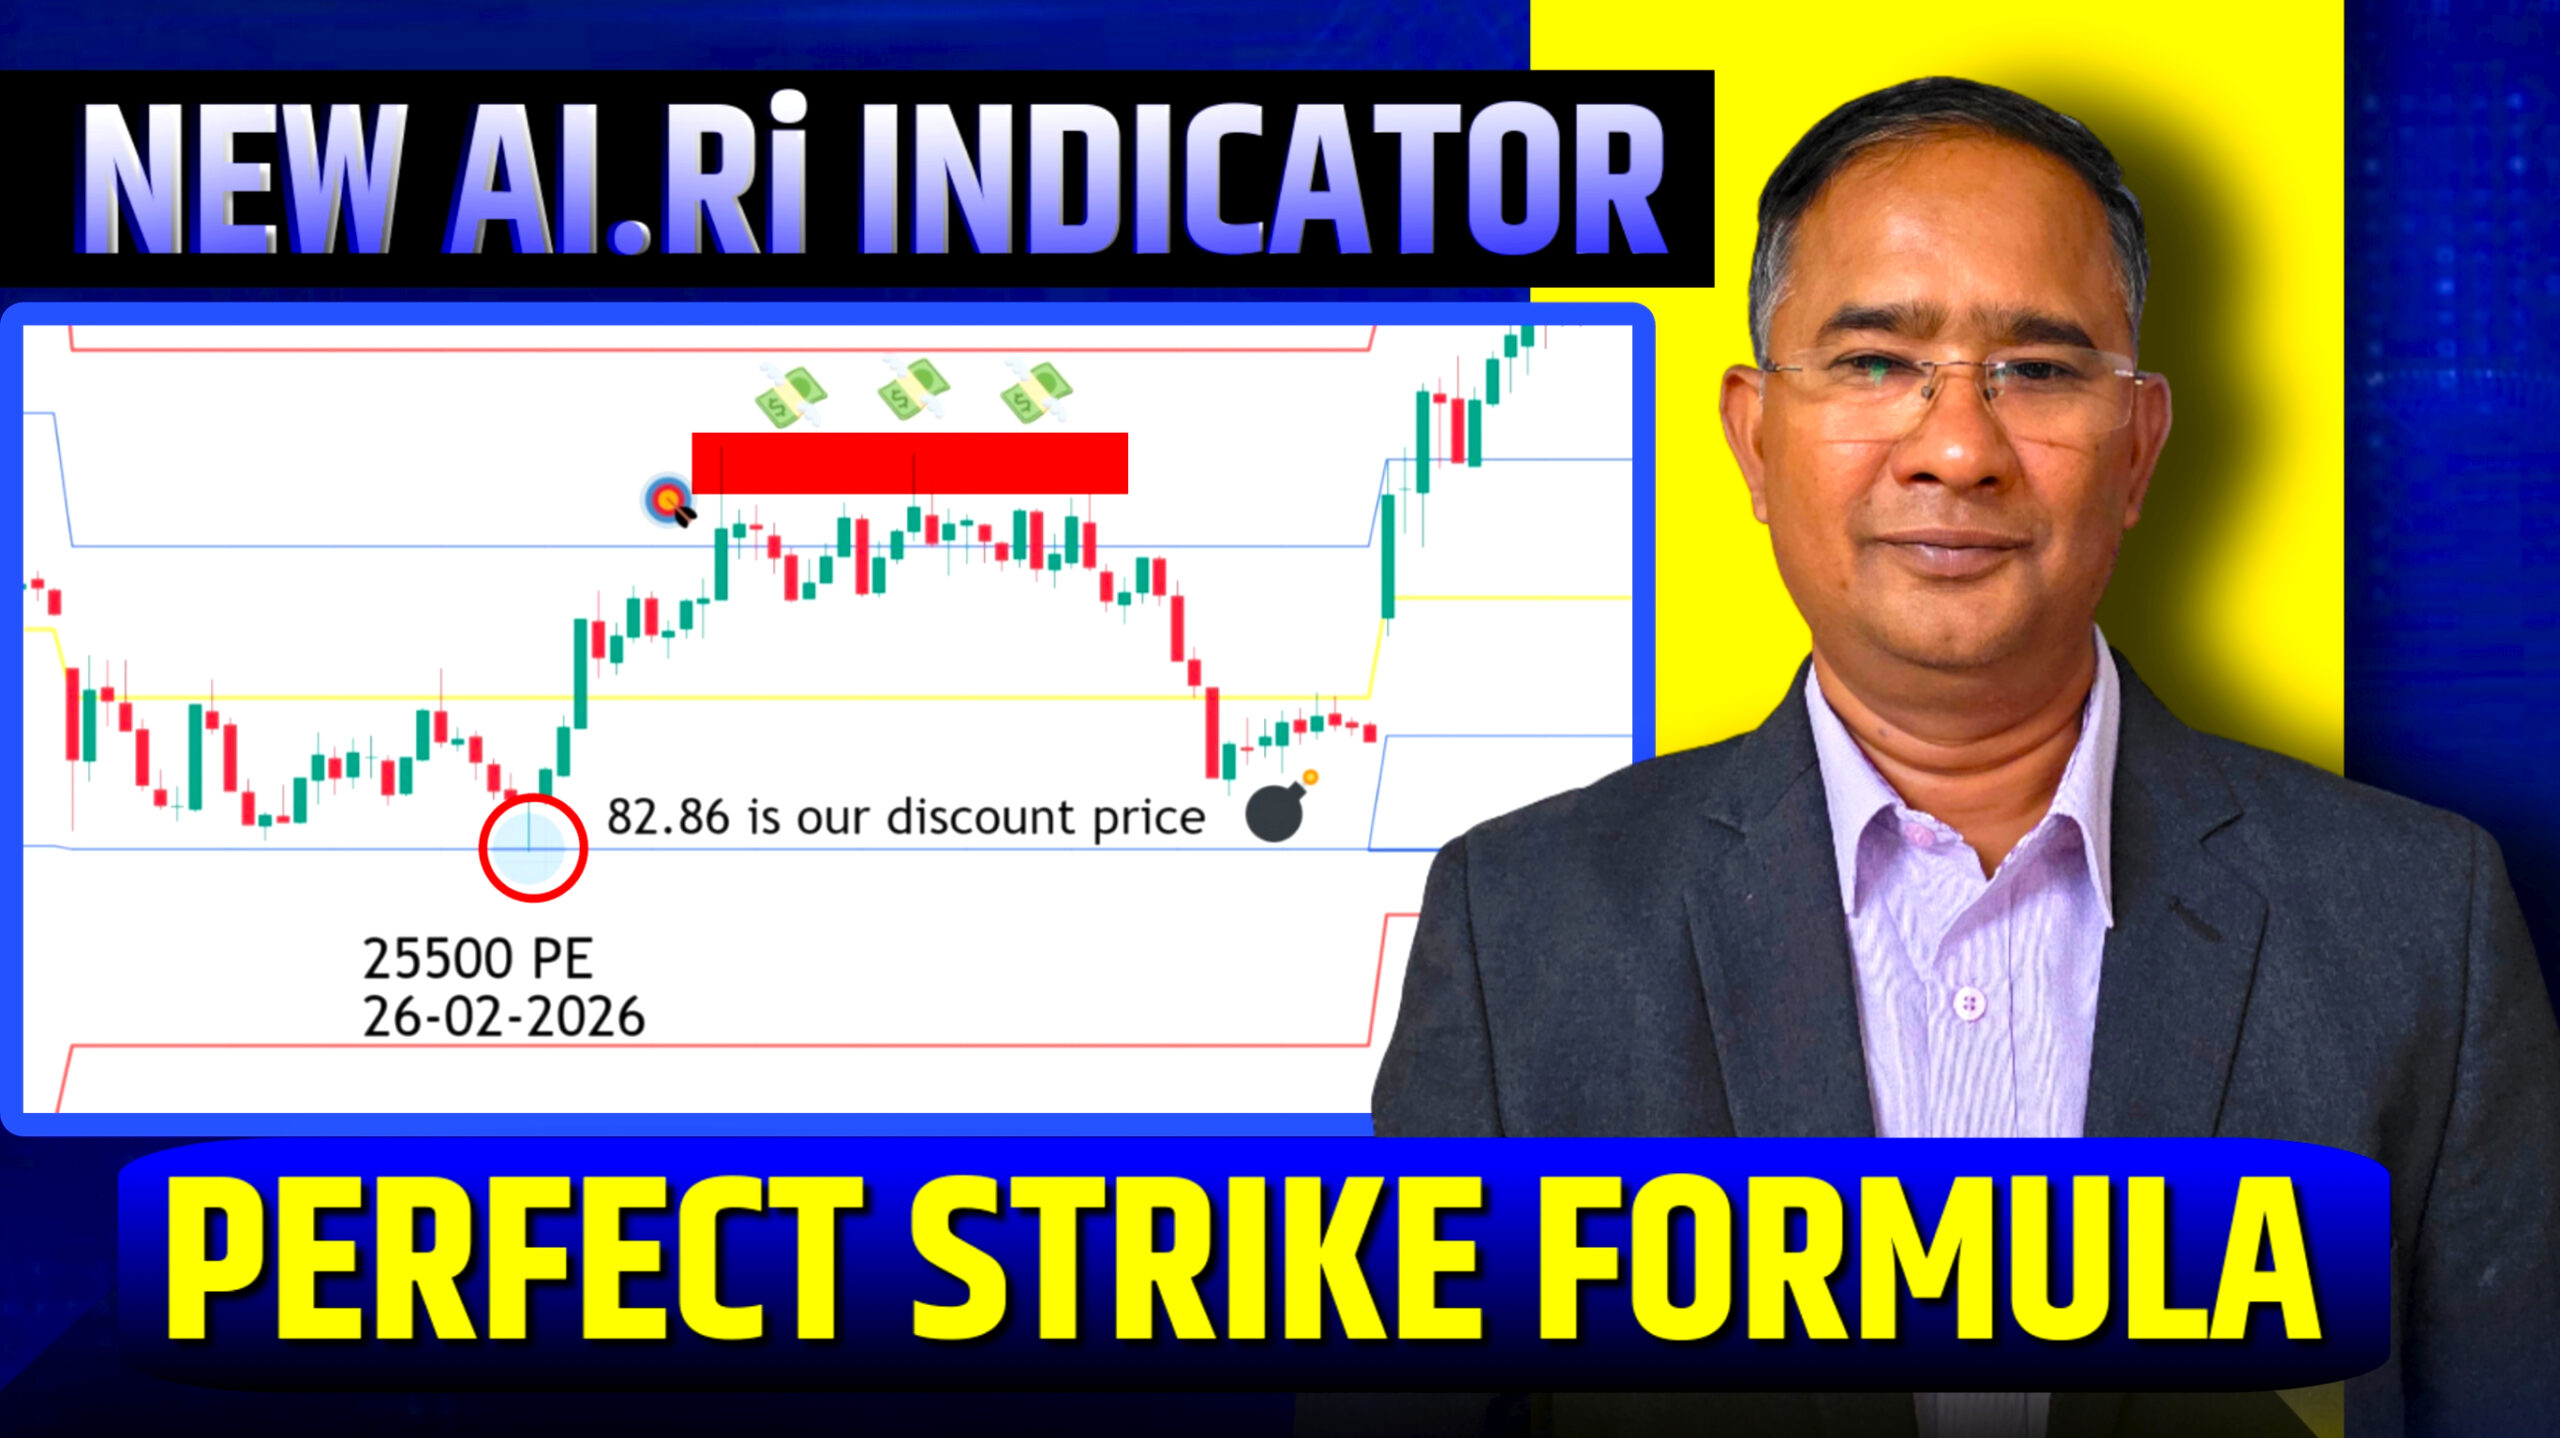
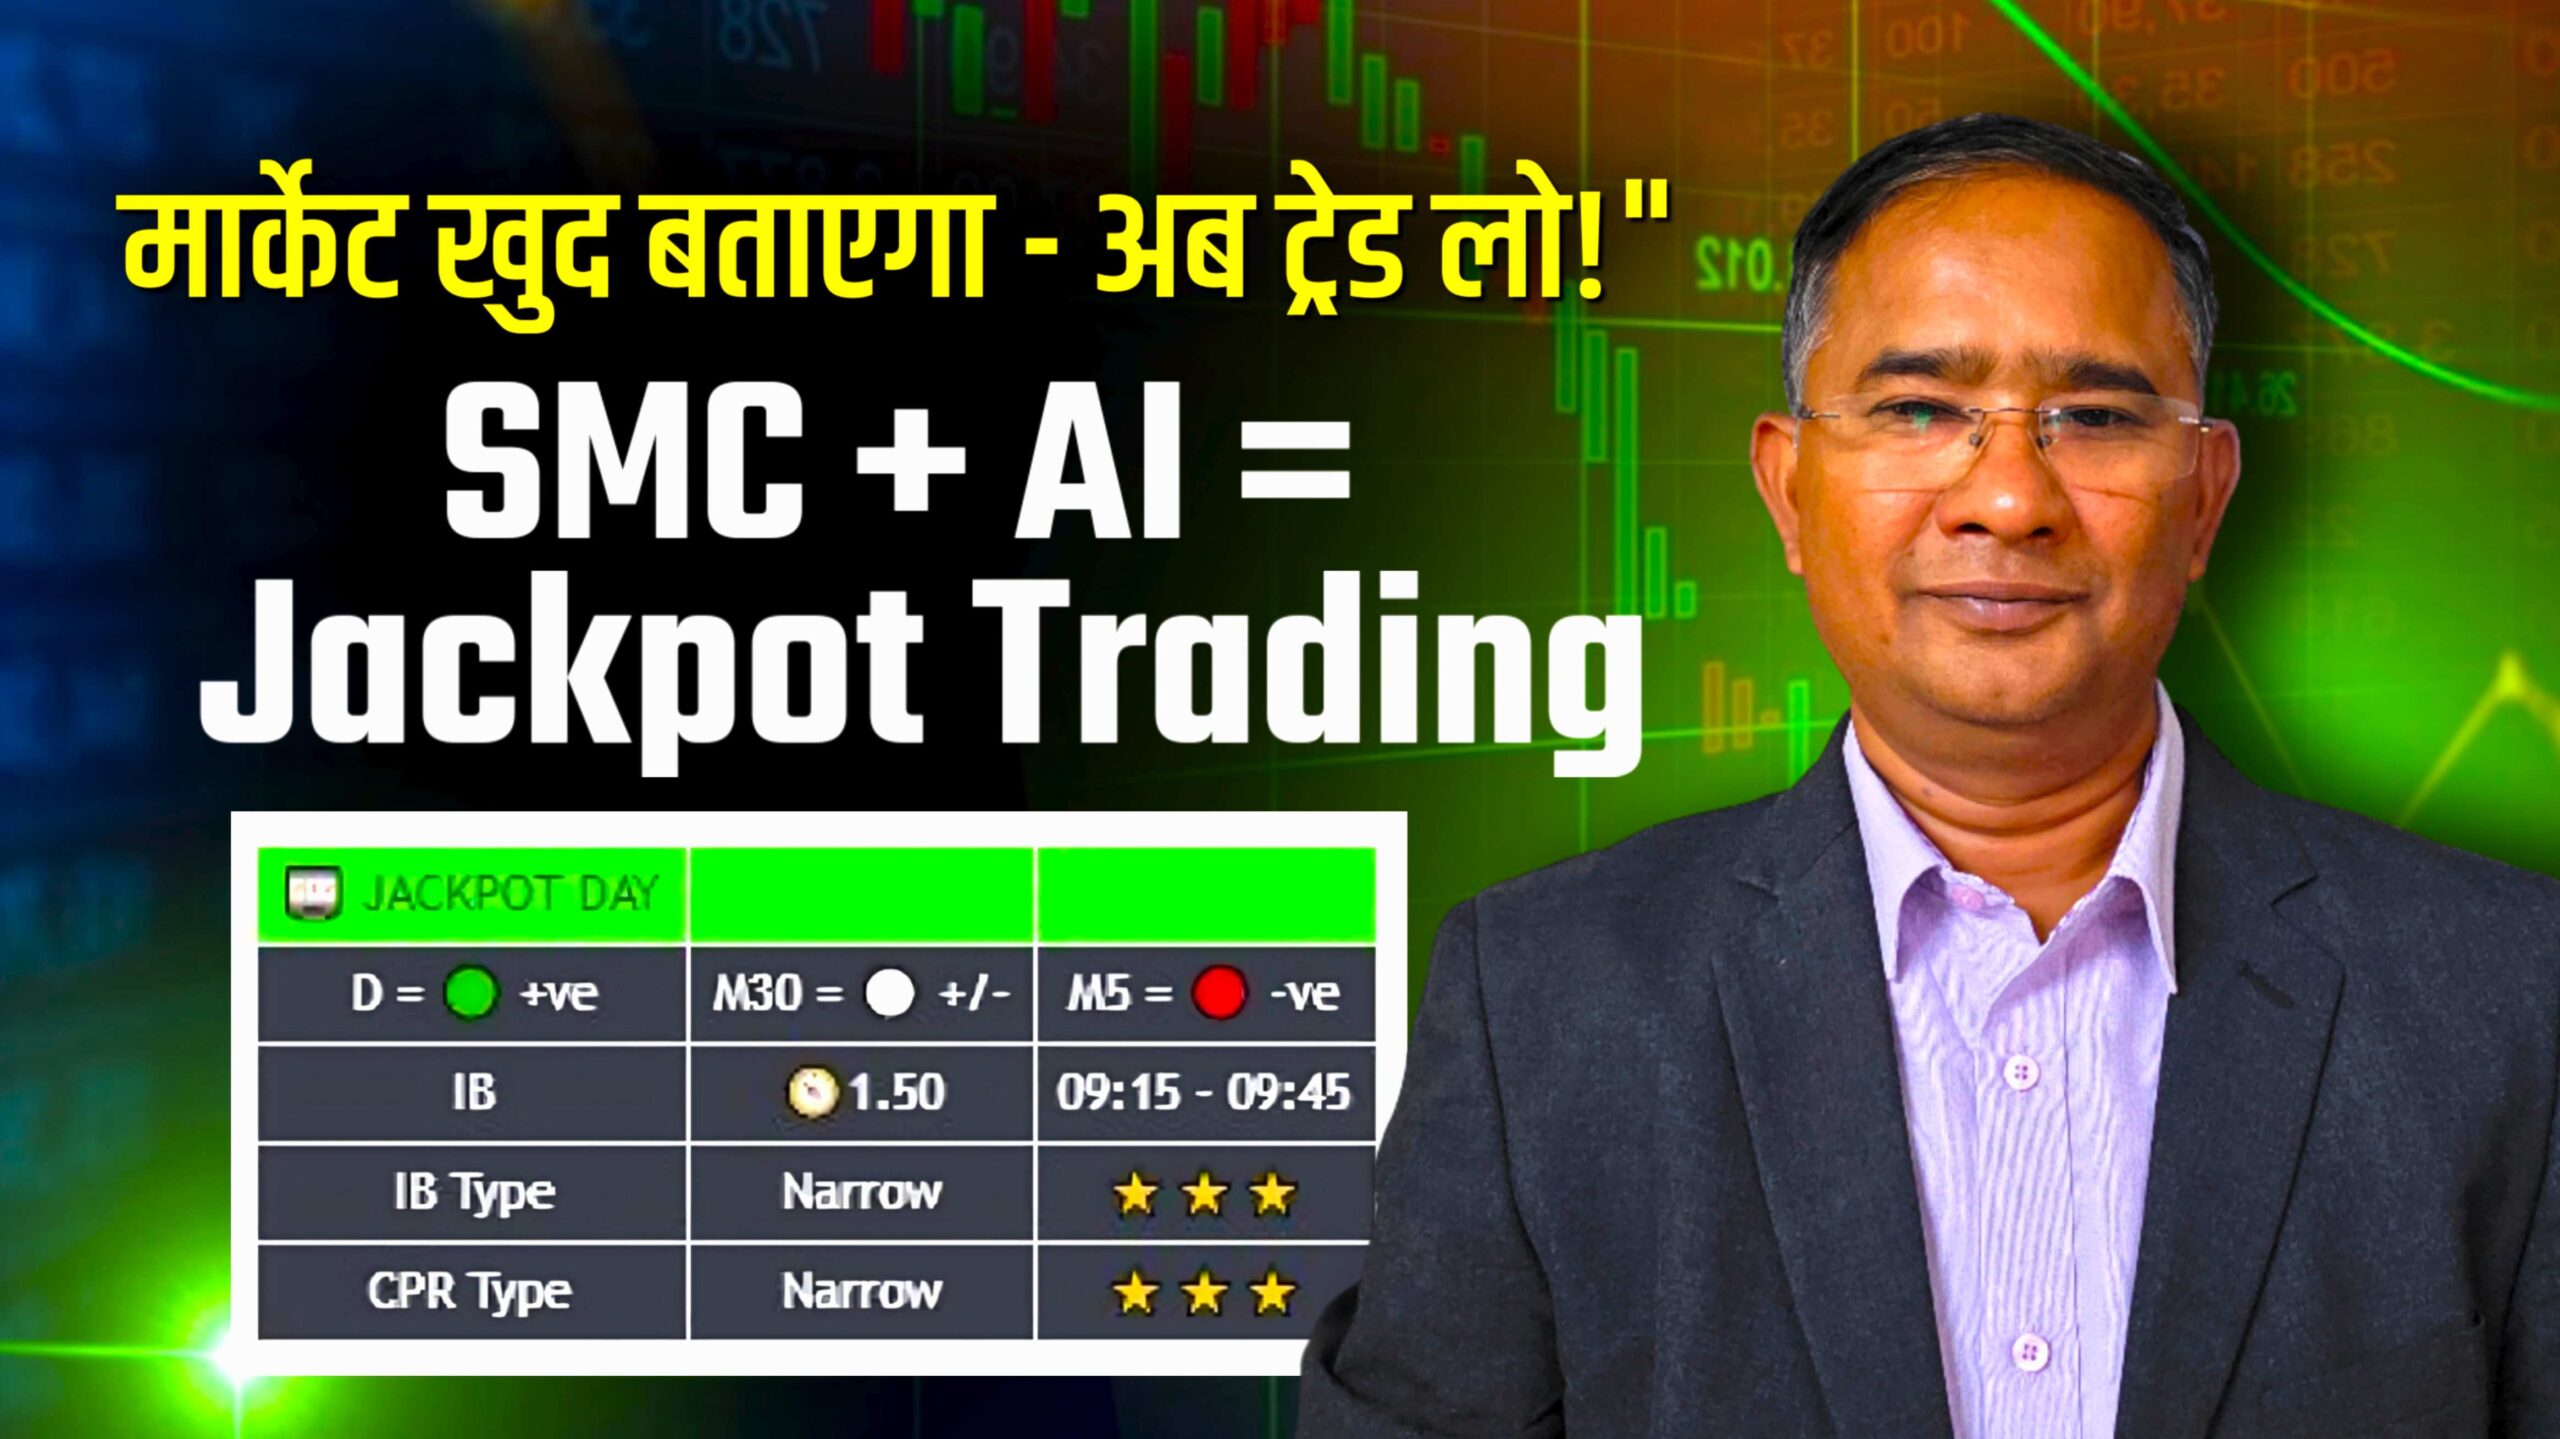
Jackpot Day
Jackpot Day is a dynamic and advanced classification. The day initially appears as a Booming Day and later confirms itself based on real-time market behavior.
Key characteristics:
- Indicates maximum opportunity
- Recommended quantity: full size (3/3rd)
- Not a false signal but a live market validation
- Very few indicators offer this adaptive feature
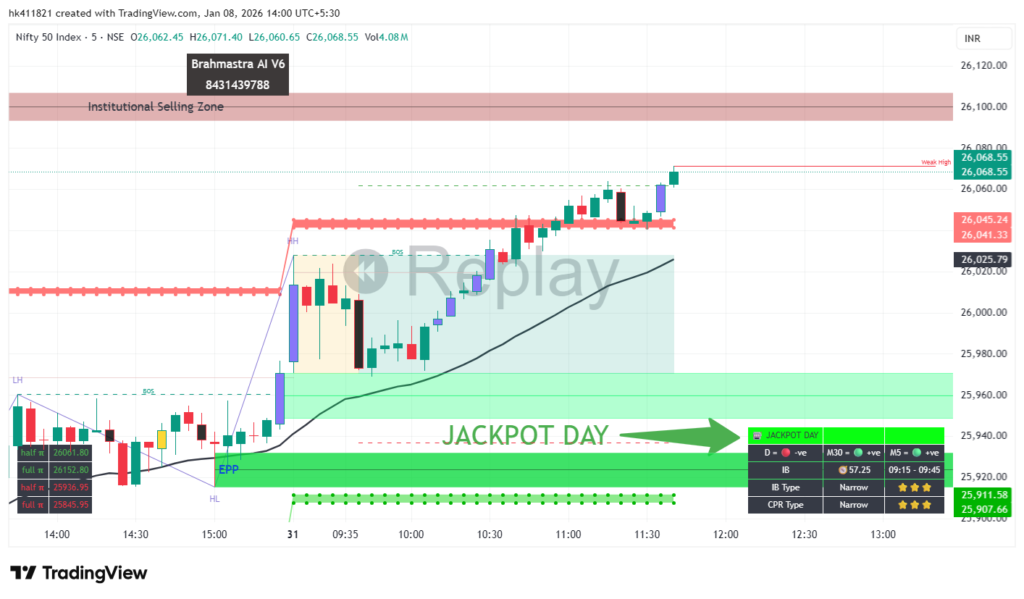
Img :- 2.5 Jackpot day example
Multi-Timeframe Market Sentiment – Alignment Across Timeframes
The second row of the Pulse Dashboard shows market sentiment across multiple user-selected timeframes. Traders can choose any three timeframes such as Daily, M30, and M5 to understand market alignment.
Sentiment is displayed using colored circles:
- Green indicates positive sentiment
- Red indicates negative sentiment
- White indicates neutral sentiment
When all selected timeframes align in one direction, the probability of achieving consistent risk-reward improves significantly.
Img :- 3.1 showing positive and negative market view in different timeframes
Counter-Trend Trade Awareness
If the higher timeframe sentiment is positive and a trader takes short positions, those trades are classified as counter-trend trades. In such cases, traders are advised to lock profits at a strict 1:1 risk-reward and avoid holding positions emotionally.
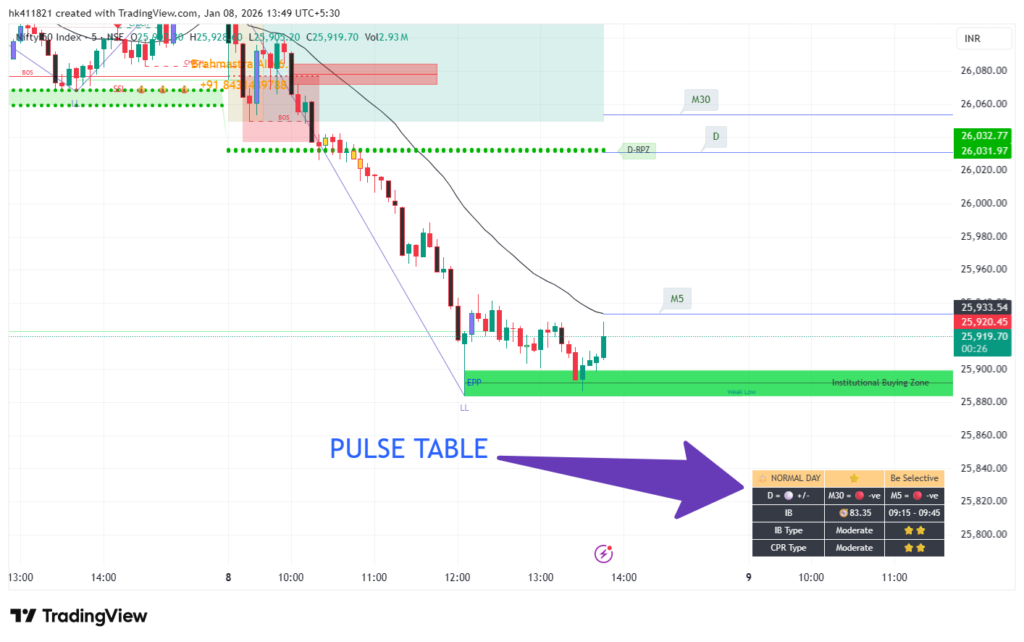
Initial Balance (IB) – Avoiding Low-Quality Trades
The third row of the Pulse Dashboard highlights the Initial Balance (IB). For Indian markets, IB represents the first 30 minutes of the trading session, while it varies in Forex markets.
According to Market Profile theory, the market often consolidates within the IB range. Stop-loss hunts and fake moves are more common during this phase. The Pulse Dashboard clearly guides traders to avoid trading inside the IB zone and wait for structure clarity.
IB Type – Reading Market Intent Early
The fourth row displays the IB Type, which gives insight into how the market is likely to behave after the initial phase.
– Moderate IB indicates sideways movement within a defined range
– Wide IB suggests price prefers to stay inside the range and may trap traders
– Narrow IB signals compression and a high probability of a strong directional move
CPR Type – Direction or Consolidation Clarity
The fifth row shows the CPR (Central Pivot Range) type, which further strengthens market context.
– Narrow CPR suggests high probability of a directional move
– Moderate CPR indicates a balanced market
– Wide CPR warns traders to avoid overtrading due to consolidation
Img :- 7.1 showing cpr on charts and in pulse table also
Why Pulse Dashboard Gives Brahmastra Traders an Edge
Most indicators only focus on buy and sell signals. Brahmastra AI goes beyond that by providing market context, psychological clarity, and risk guidance.
The Pulse Dashboard helps traders:
– Adjust quantity intelligently
– Avoid low-probability trading days
– Understand market psychology
– Trade with discipline instead of emotions
Final Thoughts
Successful trading is not about trading every day or every move. It is about trading the right day, with the right mindset, and the right quantity.
The Pulse Dashboard in Brahmastra AI Indicator V6.1 is designed to help traders measure the true pulse of the market before risking their capital.
Join the Brahmastra Trading Ecosystem
If you want to apply market structure, supply & demand, and smart money logic consistently in real markets, connect with us below:
🔔 Telegram – Free Learning & Market Updates
👉 https://t.me/trAding_Learner
🌐 Official Website – Indicator & Resources
👉 https://tradingbrahmastra.com
🎓 LMS Portal – Structured Trading Education
👉 https://lms.tradingbrahmastra.com
▶️ YouTube Channel – Practical Market Education
👉 https://www.youtube.com/@trading_Learner
⚠️ Disclaimer
Trading involves risk. All content shared on this website, Telegram channel, LMS portal, and YouTube channel is for educational purposes only and should not be considered financial advice. Always manage risk responsibly and trade