Introduction: Why Understanding Market Value Matters
The stock market has always rewarded traders who understand value and punished those who chase price movements.
Every rally in the market usually begins from discount zones, and every collapse often starts from premium zones. However, most retail traders fail to identify where the market is truly cheap or expensive. They rely on lagging indicators, emotional reactions, or breakout chasing without understanding institutional positioning.
Professional traders operate differently.
Institutions accumulate positions when the market is undervalued and distribute positions when it becomes overvalued. They defend equilibrium levels and create liquidity traps that confuse retail traders.
This is where the AiRi Indicator (Artificial Intelligence Reversal Indicator) comes into play.
AiRi is a structured value-mapping trading framework designed to help traders identify high-probability intraday reversal zones using premium, discount, and equilibrium logic.
Instead of asking:
“Where will price go?”
AiRi teaches traders to ask:
“Where is price currently located in the value cycle?”
Because direction without location is gambling, but direction with value is strategy.
AiRi
What is the AiRi Indicator?
In financial markets, reversals rarely occur randomly. They usually happen at specific locations where:
- Momentum becomes exhausted
- Liquidity shifts
- Market positioning changes
Unfortunately, most traders recognize these turning points only after the move has already occurred.
The AiRi Indicator was developed to solve this problem by identifying five key price levels that define market value.
These five levels include:
- Two Premium Prices
- Two Discount Prices
- One Equilibrium Price
Together, these levels create a complete intraday value map.
Premium Levels
Premium levels represent overvalued market zones.
When price reaches these areas:
- The market becomes stretched
- Smart money begins distribution
- Late buyers often get trapped
Discount Levels
Discount zones represent undervalued market areas where:
- Institutions begin accumulation
- Buyers gain advantage
- Price often prepares for upward expansion
Equilibrium Level
Equilibrium acts as the control point of the market.
It represents the fair value where buyers and sellers are balanced. When equilibrium breaks, momentum shifts toward premium or discount levels.
AiRi is not a simple technical indicator. It is built using Artificial Intelligence, machine learning concepts, and quantitative mathematical models to calculate high-probability reaction zones.
AiRi
Why AiRi is Designed for Intraday Trading
Many traders ask whether AiRi can be used for swing trading or positional trading.
The direct answer is no.
AiRi was intentionally designed for intraday traders and scalpers, particularly those operating in high-liquidity markets like NIFTY and BankNifty.
Higher timeframes behave differently because they are influenced by:
- Macroeconomic events
- Long-term capital flows
- Institutional hedging strategies
- Broader sentiment cycles
These macro movements dilute the precision of intraday value models.
AiRi works best where:
- Market participation is high
- Liquidity is aggressive
- Price rotates rapidly between value extremes
This environment exists primarily in 1-minute and 5-minute charts.
Think of AiRi like a Formula 1 car.
It dominates the racetrack but is not designed for off-road terrain.
Similarly, AiRi excels in intraday trading environments but is not optimized for long-term positional strategies.
AiRi
Where Should You Use the AiRi Indicator?
One common mistake in trading education is claiming that a tool works in every market and timeframe.
AiRi was not designed as a universal indicator.
Based on extensive backtesting, AiRi performs best in index-based instruments, including:
- NIFTY50 Spot
- NIFTY Futures
- BankNifty Spot
- BankNifty Futures
- Sensex
- Options premium charts
These instruments offer:
- High liquidity
- Strong participation
- Rapid price rotation
When participation is high, reactions near premium and discount zones become stronger and more predictable.
AiRi can be used on:
- 5-minute charts for stable intraday levels
- 1-minute charts for precise entries
Some traders have also reported success using AiRi on stocks. However, traders are advised to backtest at least 50–100 occurrences before applying the system to individual equities.
AiRi promotes data-based trading rather than blind belief.
AiRi
How to Use the AiRi Indicator
Using AiRi begins with understanding the display settings and the five-level price structure.
Setting Up the Display Mode
The AiRi indicator includes a Display Levels Mode.
There are two modes available:
Current Day Mode
This mode displays only the levels for the current trading session. It helps maintain a clean chart and improves focus during live trading.
Historical Mode
Historical mode shows levels from previous sessions. This feature is extremely useful for backtesting and understanding price reactions.
Backtesting helps traders develop confidence in the system.
Understanding the Five Price Structure
AiRi revolves around a simple structure:
- 1 Equilibrium price
- 2 Discount prices
- 2 Premium prices
These five levels create a complete value framework for intraday trading.
Market Behavior Around Equilibrium
Most trading sessions begin near equilibrium.
From this level:
- If buyers dominate → price moves toward Premium 1 and Premium 2
- If sellers dominate → price moves toward Discount 1 and Discount 2
Equilibrium acts as the decision point of the market.
Reaction Logic at Premium and Discount Zones
When price moves from equilibrium to Premium 1, the market enters the first overvalued area.
Many times, price reacts from Premium 1 and returns toward equilibrium.
If Premium 1 fails to produce a reversal, Premium 2 becomes the final extreme zone where strong reactions often occur.
The same logic applies to discount zones.
If Discount 1 fails to hold, price often continues toward Discount 2, which represents the final undervalued territory.
These patterns are based on extensive historical observation and market behavior studies.
The Pullback Phenomenon
Another common behavior observed in AiRi levels is the pullback retest phenomenon.
When price breaks beyond Premium 1 or Discount 1, it often returns to retest the broken level before continuing toward Premium 2 or Discount 2.
Example:
If Discount 1 is located at 25,640 and Discount 2 at 25,450, price may initially break below 25,640 but later pull back to retest that level before continuing downward.
This retest strengthens the continuation probability.
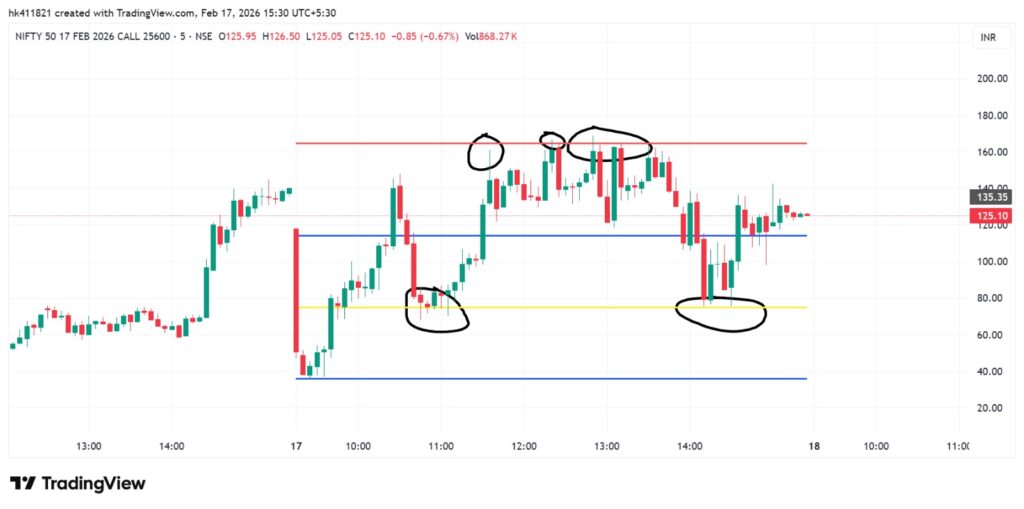
Trade Execution Framework
AiRi levels help traders identify high-probability trade locations.
For example:
If price reaches Premium 1 and shows rejection, traders may consider short positions.
The first logical target becomes equilibrium.
After equilibrium is reached, traders may partially exit and trail the remaining position toward discount levels.
For option traders:
- Option buyers prefer discount zones
- Option sellers prefer premium zones
AiRi focuses on location-based trading rather than prediction-based trading.
The Two Questions Every AiRi Trader Must Ask
When using AiRi, traders only need to ask two questions:
- Where is the current price?
- Where is price likely rotating next?
These two questions simplify decision-making and remove emotional trading.
AiRi and Brahmastra Confluence
AiRi is not designed to be used alone.
It works best when combined with the Brahmastra indicator, which helps identify institutional structure and liquidity zones.
AiRi identifies where value exists.
Brahmastra confirms when execution should happen.
Together, they form a powerful confluence system for intraday trading.
AiRi
How to Select Strike Price Using AiRi
Strike selection is one of the most important aspects of options trading.
Many traders make the mistake of focusing only on market direction without considering strike positioning.
AiRi provides a systematic approach to strike selection.
Always Use the M5 Equilibrium
The most important rule is:
Use the 5-minute equilibrium price as the base reference.
For example:
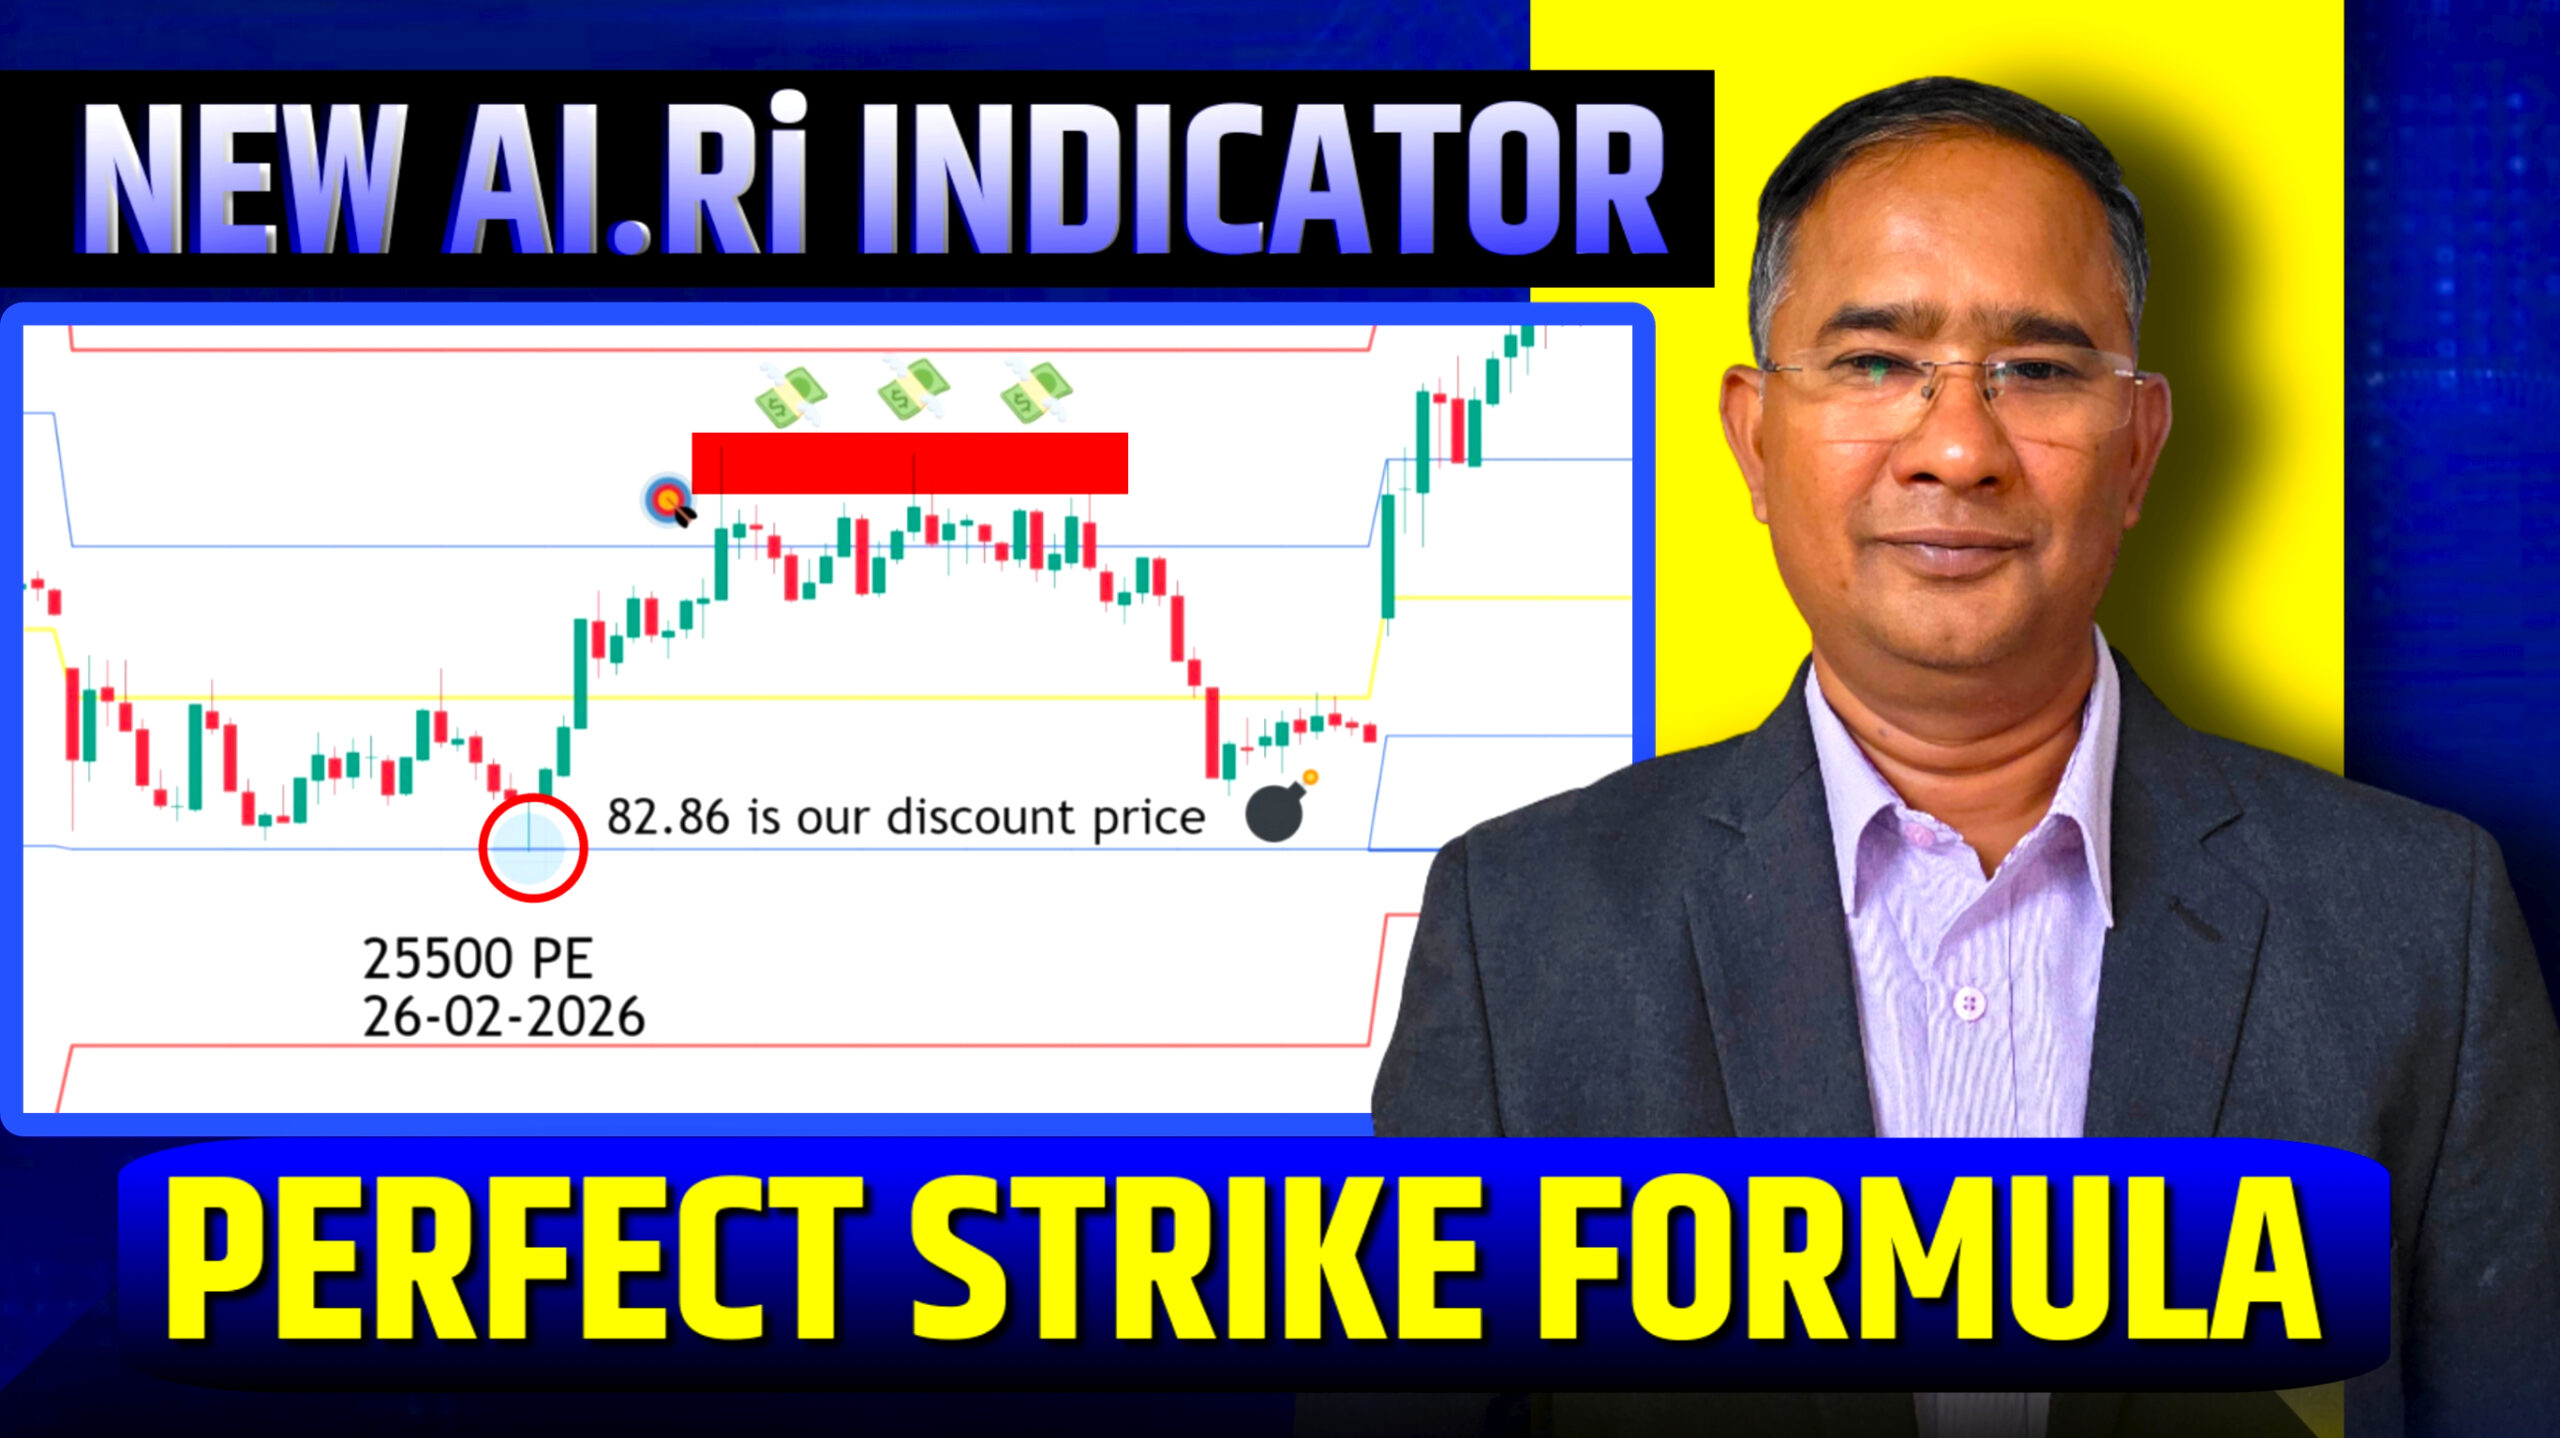
If NIFTY M5 equilibrium is 25,456, the nearest 100-point strike becomes 25,500.
Instead of analyzing multiple strikes, traders should focus on:
- 25,500 CALL
- 25,500 PUT
These become the primary analysis strikes.
ITM vs OTM Strike Behavior
Sometimes traders feel uncomfortable trading OTM options.
AiRi allows traders to analyze the reference strike and execute trades on nearby strikes.
For example:
If reversal appears on the 25,500 PUT, traders may execute on 25,700 PUT depending on their risk tolerance.
The key principle is:
Analysis comes from the anchor strike, execution depends on trader comfort.
Why 100-Point Strike Levels Matter
Round-number strikes attract larger market participation.
Both institutional and retail traders focus heavily on these levels.
As a result:
- Open interest becomes concentrated
- Price reactions become stronger
- Liquidity behavior becomes more structured
Using 100-point strikes aligns the strategy with market psychology.
How to Perform Cross Analysis with AiRi
Cross analysis is one of the most powerful concepts in the AiRi framework.
Many traders initially feel confused when they hear that both call and put strikes must be analyzed simultaneously.
However, this technique helps confirm market intent.
The Anchor Strike Concept
Suppose NIFTY equilibrium is 25,456.
The nearest strike becomes 25,500.
You must analyze both:
- 25,500 CALL
- 25,500 PUT
These two instruments act as mirror structures.
Observing Call Structure
Example AiRi levels for the 25,500 CALL:
- Premium 2 – 300
- Premium 1 – 230
- Equilibrium – 180
- Discount 1 – 130
- Discount 2 – 70
If price reaches Premium 1 and shows rejection, the CALL option becomes overvalued.
But the analysis does not stop there.
Confirming with Put Structure
Next, analyze the 25,500 PUT levels.
Example:
- Premium 2 – 295
- Premium 1 – 240
- Equilibrium – 175
- Discount 1 – 150
- Discount 2 – 60
If the CALL is at Premium while the PUT is near Discount, a structural imbalance appears.
This indicates a potential downside reversal in the underlying index.
Analysis vs Execution
Analysis must always remain anchored to the selected strike.
Execution, however, may shift depending on trading style and risk comfort.
Traders should never randomly change their analysis strike.
The Philosophy of Cross Analysis
Cross analysis teaches traders to observe balance and imbalance.
If CALL is at premium and PUT is at discount → look for PUT opportunities.
If PUT is at premium and CALL is at discount → look for CALL opportunities.
This approach removes guesswork and replaces it with probability-based decision making.
Final Thoughts: AiRi is a Value Intelligence System
AiRi is more than an indicator.
It is a framework that teaches traders to understand where price stands within the value cycle.
When combined with:
- M5 equilibrium logic
- Premium and discount zones
- Structured strike selection
- Cross analysis confirmation
traders can shift from emotional trading to probability-based execution.
AiRi does not simply mark levels.
It teaches traders how to think like institutions.
Because in the stock market:
“Location creates conviction, and conviction creates profit.”
Join the Brahmastra Trading Ecosystem
🔔 Telegram – Free Learning & Market Updates
👉 https://t.me/trAding_Learner
🌐 Official Website – Indicator & Resources
👉 https://tradingbrahmastra.com
🎓 LMS Portal – Structured Trading Education
👉 https://lms.tradingbrahmastra.com
▶️ YouTube Channel – Practical Market Education
👉 https://www.youtube.com/@trading_Learner
⚠️ Disclaimer
Trading involves risk. All content shared on this website, Telegram channel, LMS portal, and YouTube channel is for educational purposes only and should not be considered financial advice. Always manage risk responsibly and trade