Order Flow Trading in India & Market Profile Hindi
🔹 What Is Order Flow Trading? (Indian Market Perspective)
Order Flow Trading is a professional market analysis approach that focuses on actual buying and selling activity as it happens, instead of relying on indicators or historical price patterns.
In simple terms, order flow focuses on how traders are behaving at a price, not on what indicators suggest might happen next. It studies the interaction between buyers and sellers in real time and helps traders understand whether the market is comfortable trading at a level or trying to move away from it.
In Indian markets, price often moves sharply, pauses unexpectedly, or reverses without warning. These movements are not random. They occur because of participation, hesitation, absorption, or rejection by market participants. Order Flow Trading allows traders to read these behaviours directly, rather than guessing outcomes.
Unlike traditional technical analysis, which mostly looks at historical candles, order flow gives insight into current market intent.
At Trading Learner, order flow is taught as a reaction-based trading skill. The goal is not prediction, targets, or opinions — the goal is alignment with real market behaviour.
https://tradingbrahmastra.com/
🔹 Understanding Order Flow in Indian Trading Markets
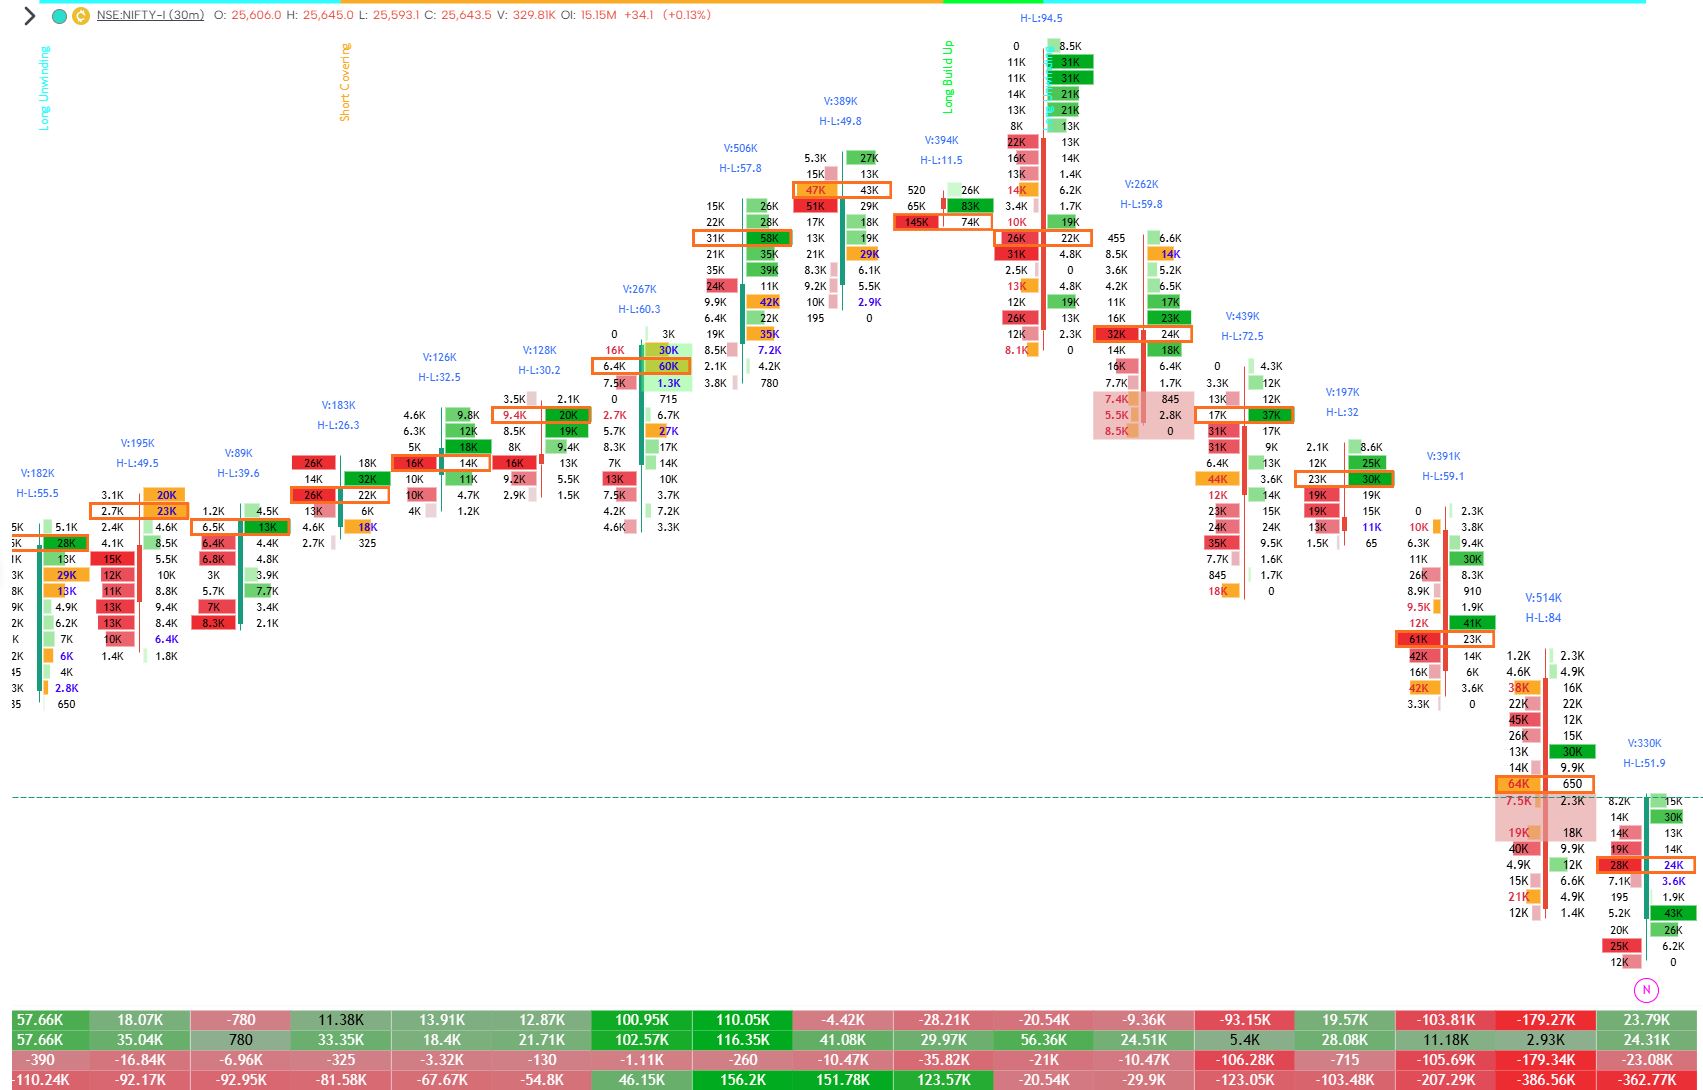
Order flow represents the continuous stream of buy and sell orders entering the market throughout the trading session. Every executed trade contributes to how the market discovers value.
In Indian markets — especially index, stock, and options trading — price movement is driven by:
Aggressive participation (urgency to buy or sell)
Passive participation (defending price levels)
Absence of participation (lack of interest)
Large participants influence price when they actively transact, while smaller participants often react after movement has already begun. Order flow helps traders recognise this difference.
Instead of assuming a breakout or breakdown is meaningful, order flow encourages traders to ask:
Is price being accepted here?
Is activity increasing or drying up?
Is movement supported by participation or just short-term imbalance?
🔹 How Order Flow Trading Actually Works
Order Flow Trading works by observing executed trades alongside price response.
Rather than focusing only on candles, traders study:
Volume traded at specific prices
Aggressive buying versus aggressive selling
Speed of execution
Price response after activity appears
These elements help determine whether the market is strengthening, stalling, or rejecting a move.
Three core ideas are commonly used in order flow analysis:
Footprint-style analysis visualises where trading activity actually occurred within a price move
Delta analysis compares buying pressure and selling pressure to understand directional bias
Cumulative delta tracks pressure over time to reveal whether participation is consistent or fading
Reading order flow effectively requires screen time. What looks obvious in hindsight often feels unclear in live markets. This is why order flow is treated as a skill, not a shortcut.
https://youtu.be/579NL0qNrLo
🔹 Beginner-Friendly Order Flow Concepts (Indian Context)
For Indian learners, order flow becomes practical when simplified into repeatable market behaviours rather than complex data.
Absorption
When price tests a level repeatedly but fails to move further, it suggests strong participation defending that area.
Rejection
When price moves away quickly from a level with little trading activity, it indicates the market did not accept those prices.
Exhaustion
When aggressive activity fails to push price further, it signals that momentum may be weakening.
These concepts help traders understand market response, not just market movement.
Risk control remains critical. Order flow improves clarity, but it does not remove uncertainty.
Order Flow Video Explanation (Hindi)
Market Profile Structure (Market Profile Hindi)
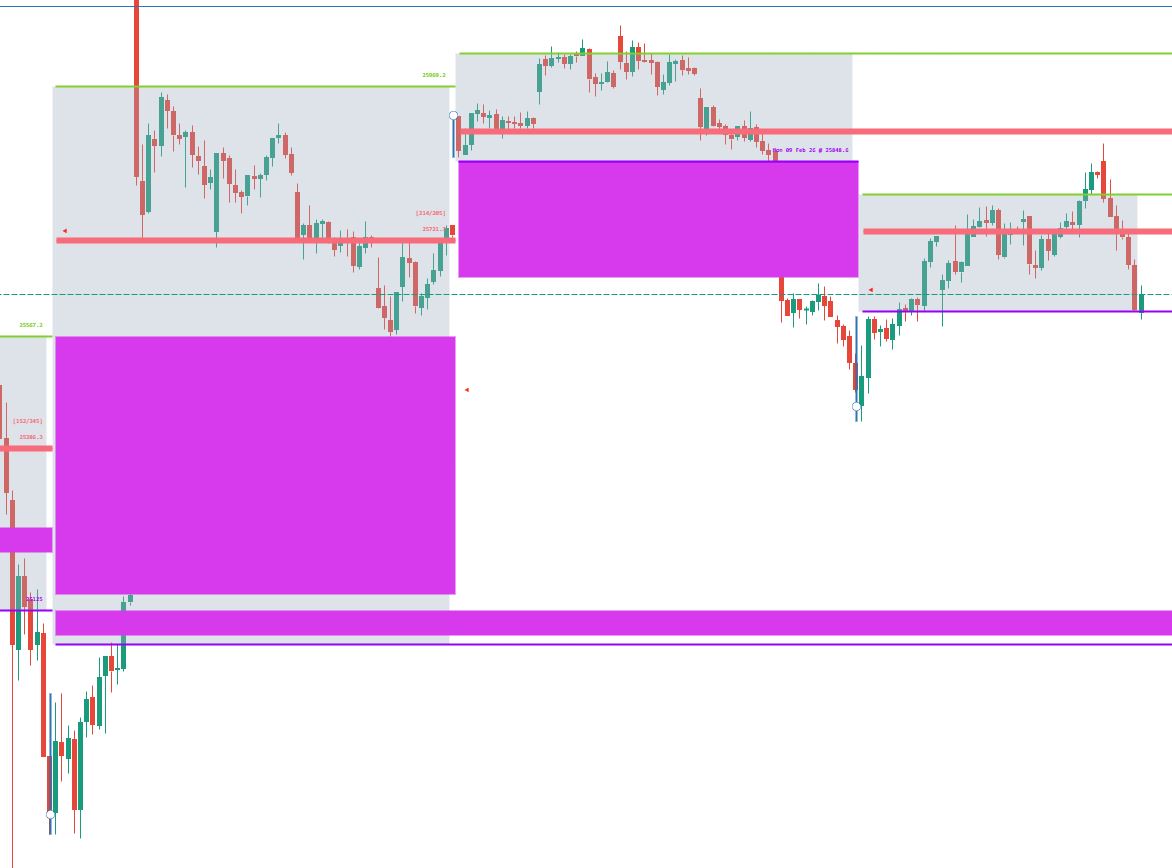
Market Profile Hindi market ke behaviour ko structure ke through samjhata hai. Ye batata hai ki market kis price ko accept kar raha hai aur kis price ko reject kar raha hai.
Market Profile explains market behaviour through structure rather than indicators. Its purpose is not to predict future prices, but to help traders understand where the market is comfortable trading and where it is not.
In Indian markets, Market Profile is especially effective because price movement is heavily influenced by participation. Market Profile highlights where the market spent time and where it moved quickly, revealing acceptance, rejection, and potential continuation zones.
By analysing Market Profile structure, traders gain context before execution. Instead of reacting emotionally to price movement, they understand whether the market is building value, rejecting prices, or transitioning between states.
Initial Balance (IB)
Trading session ke early hours ka range.
The Initial Balance represents the price range formed during the early part of the trading session. This range acts as the first structural reference for the day and often defines the boundaries within which the market will either rotate or expand.
When price remains inside the Initial Balance, the market typically exhibits balanced behaviour with two-sided trade. A strong move outside the Initial Balance, supported by participation, often signals directional intent for the session.
Value Area
Fair value zone jahan maximum trading activity hoti hai.
The Value Area represents the price zone where the majority of trading activity occurred. It reflects the area of perceived fair value, where both buyers and sellers were willing to transact comfortably.
Markets naturally gravitate toward value. When price moves outside the Value Area, traders observe whether the market accepts the new prices or quickly rejects them.
Point of Control (POC)
Sabse zyada traded price — intraday reference.
The Point of Control is the most actively traded price within a given session or profile. It often behaves as a reference level, especially during balanced market conditions.
Strong acceptance at the Point of Control suggests stability, while repeated rejection can indicate that the market is attempting to shift value to a new area.
Single Prints
Strong rejection ke zones.
Single Prints occur when price moves rapidly through a level with very little trading activity. These areas indicate rejection and often represent emotional or imbalanced participation.
When price revisits Single Print zones, the market will either reject the area again or attempt to repair it through increased participation.
https://youtu.be/dOQNVFGHkL8
🔹 Order Flow Tools for Indian Traders
Order flow analysis requires access to volume-based market data and visual tools that highlight participation and structure.
Indian traders typically use platforms that support:
Volume Profile
Delta-based studies
Market structure visualisation
Reliable Indian market data
The platform matters less than the trader’s ability to interpret information. Clean data and consistent observation are more important than advanced features.
https://youtu.be/Kl61wr-vSeA
🔹 Reading Order Flow Charts and Market Structure
Order flow charts help traders understand where the market found value and where it did not.
High-activity areas often act as balance zones
Low-activity areas often represent rejection
The most traded price often behaves like a reference point
Instead of drawing arbitrary lines, order flow focuses on actual transactions.
Context is essential. In low-participation conditions, signals can be misleading.
🔹 Common Order Flow Trading Mistakes
Many traders struggle with order flow due to expectations rather than data.
Assuming large volume always means strength
Tracking too many metrics at once
Overtrading small signals
Ignoring discipline and transaction costs
Order flow shows what is happening, not why it is happening. Without structure, it can be misread.
🔹 Getting Started with Order Flow Trading (India)
Order Flow Trading should be approached as a long-term learning process.
Observation and replay
Focus on liquid Indian instruments
Small position size while learning
Capital protection first
Order flow does not offer shortcuts. It rewards patience, discipline, and the ability to stay inactive when the market is unclear.
https://youtu.be/X7H7CYLqYCY
Risk Management in Order Flow Trading
Order Flow Trading improves entry precision and market clarity, but long-term consistency depends entirely on disciplined risk management.
Order Flow Trading improves entry precision and market clarity, but long-term consistency depends entirely on disciplined risk management. Professional traders define risk before seeking opportunity.
Indian markets can shift rapidly due to volatility, news flow, and derivatives activity.
- Small size se start
- Context ke against trade nahi
- Capital protection first
- Start with small position size to protect capital during the learning phase
- Avoid trading against higher-timeframe or session context
- Do not hold positions without clear acceptance from the market
- Always prioritise capital preservation over profit targets
Order flow does not eliminate uncertainty. Instead, it exposes uncertainty clearly.